Capital Budgeting Techniques

Capital budgeting is the process most companies use to authorize capital spending on long‐term projects and on other projects requiring significant investments of capital. Because capital is usually limited in its availability, capital projects are individually evaluated using both quantitative analysis and qualitative information. Most capital budgeting analysis uses cash inflows and cash outflows rather than net income calculated using the accrual basis. Some companies simplify the cash flow calculation to net income plus depreciation and amortization. Others look more specifically at estimated cash inflows from customers, reduced costs, proceeds from the sale of assets and salvage value, and cash outflows for the capital investment, operating costs, interest, and future repairs or overhauls of equipment.
 

The Cottage Gang is considering the purchase of $150,000 of equipment for its boat rentals. The equipment is expected to last seven years and have a $5,000 salvage value at the end of its life. The annual cash inflows are expected to be $250,000 and the annual cash outflows are estimated to be $200,000.

Payback technique

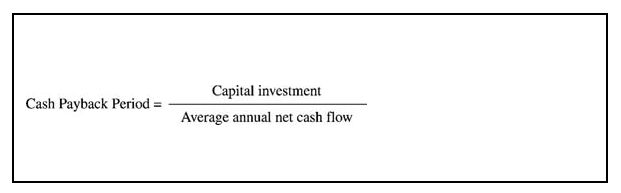
The payback measures the length of time it takes a company to recover in cash its initial investment. This concept can also be explained as the length of time it takes the project to generate cash equal to the investment and pay the company back. It is calculated by dividing the capital investment by the net annual cash flow. If the net annual cash flow is not expected to be the same, the average of the net annual cash flows may be used.

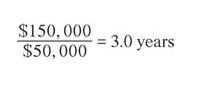
For the Cottage Gang, the cash payback period is three years. It was calculated by dividing the $150,000 capital investment by the $50,000 net annual cash flow ($250,000 inflows ‐ $200,000 outflows)

The shorter the payback period, the sooner the company recovers its cash investment. Whether a cash payback period is good or poor depends on the company's criteria for evaluating projects. Some companies have specific guidelines for number of years, such as two years, while others simply require the payback period to be less than the asset's useful life.

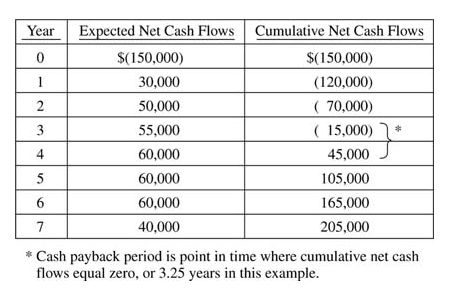
When net annual cash flows are different, the cumulative net annual cash flows are used to determine the payback period. If the Turtles Co. has a project with a cost of $150,000, and net annual cash inflows for the first seven years of the project are: $30,000 in year one, $50,000 in year two, $55,000 in year three, $60,000 in year four, $60,000 in year five, $60,000 in year six, and $40,000 in year seven, then its cash payback period would be 3.25 years. See the example that follows.

The cash payback period is easy to calculate but is actually not the only criteria for choosing capital projects. This method ignores differences in the timing of cash flows during the project and differences in the length of the project. The cash flows of two projects may be the same in total but the timing of the cash flows could be very different. For example, assume project LJM had cash flows of $3,000, $4,000, $7,000, $1,500, and $1,500 and project MEM had cash flows of $6,000, $5,000, $3,000, $2,000, and $1,000. Both projects cost $14,000 and have a payback of 3.0 years, but the cash flows are very different. Similarly, two projects may have the same payback period while one project lasts five years beyond the payback period and the second one lasts only one year.

Net present value

Considering the time value of money is important when evaluating projects with different costs, different cash flows, and different service lives. Discounted cash flow techniques, such as the net present value method, consider the timing and amount of cash flows. To use the net present value method, you will need to know the cash inflows, the cash outflows, and the company's required rate of return on its investments. The required rate of return becomes the discount rate used in the net present value calculation. For the following examples, it is assumed that cash flows are received at the end of the period.

Using data for the Cottage Gang and assuming a required rate of return of 12%, the net present value is $80,452. It is calculated by discounting the annual net cash flows and salvage value using the 12% discount factors. The Cottage Gang has equal net cash flows of $50,000 ($250,000 cash receipt minus $200,000 operating costs) so the present value of the net cash flows is computed by using the present value of an annuity of 1 for seven periods. Using a 12% discount rate, the factor is 4.5638 and the present value of the net cash flows is $228,190. The salvage value is received only once, at the end of the seven years (the asset's life), so its present value of $2,262 is computed using the Present Value of 1 table factor for seven periods and 12% discount rate factor of .4523 times the $5,000 salvage value. The investment of $150,000 does not need to be discounted because it is already in today's dollars (a factor value of 1.0000). To calculate the net present value (NPV), the investment is subtracted from the present value of the total cash inflows of $230,452. See the examples that follow. Because the net present value (NPV) is positive, the required rate of return has been met.


When net cash flows are not all the same, a separate present value calculation must be made for each period's cash flow. A financial calculator or a spreadsheet can be used to calculate the present value. Assume the same project information for the Cottage Gang's investment except for net cash flows, which are summarized with their present value calculations below.

The NPV of the project is $83,195, calculated as follows:

The difference between the NPV under the equal cash flows example ($50,000 per year for seven years or $350,000) and the unequal cash flows ($350,000 spread unevenly over seven years) is the timing of the cash flows.

Most companies' required rate of return is their cost of capital. Cost of capital is the rate at which the company could obtain capital (funds) from its creditors and investors. If there is risk involved when cash flows are estimated into the future, some companies add a risk factor to their cost of capital to compensate for uncertainty in the project and, therefore, in the cash flows.

Most companies have more project proposals than they do funds available for projects. They also have projects requiring different amounts of capital and with different NPVs. In comparing projects for possible authorization, companies use a profitability index. The index divides the present value of the cash flows by the required investment. For the Cottage Gang, the profitability index of the project with equal cash flows is 1.54, and the profitability index for the project with unequal cash flows is 1.56.

Internal rate of return

The internal rate of return also uses the present value concepts. The internal rate of return (IRR) determines the interest yield of the proposed capital project at which the net present value equals zero, which is where the present value of the net cash inflows equals the investment. If the IRR is greater than the company's required rate of return, the project may be accepted. To determine the internal rate of return requires two steps. First, the internal rate of return factor is calculated by dividing the proposed capital investment amount by the net annual cash inflow. Then, the factor is found in the Present Value of an Annuity of 1 table using the service life of the project for the number of periods. The discount rate that the factor is the closest to is the internal rate of return. A project for Knightsbridge, Inc., has equal net cash inflows of $50,000 over its seven‐year life and a project cost of $200,000. By dividing the cash flows into the project investment cost, the factor of 4.00 ($200,000 ÷ $50,000) is found. The 4.00 is looked up in the Present Value of an Annuity of 1 table on the seven‐period line (it has a seven‐year life), and the internal rate of return of 16% is determined.

Present Value of an Annuity of 1

Period

2%

4%

5%

6%

8%

10%

12%

14%

16%

18%

20%

22%

1

0.9804

0.9615

0.9524

0.9434

0.9259

0.9091

0.8929

0.8772

0.8621

0.8475

0.8333

0.8197

2

1.9416

1.8861

1.8594

1.8334

1.7833

1.7355

1.6901

1.6467

1.6052

1.5656

1.5278

1.4915

3

2.8839

2.7751

2.7232

2.6730

2.5771

2.4869

2.4018

2.3216

2.2459

2.1743

2.1065

2.0422

4

3.8077

3.6299

3.5460

3.4651

3.3121

3.1699

3.0373

2.9137

2.7982

2.6901

2.5887

2.4936

5

4.7135

4.4518

4.3295

4.2124

3.9927

3.7908

3.6048

3.4331

3.2743

3.1272

2.9906

2.8636

6

5.6014

5.2421

5.0757

4.9173

4.6229

4.3553

4.1114

3.8887

3.6847

3.4976

3.3255

3.1669

7

6.4720

6.0021

5.7864

5.5824

5.2064

4.8684

4.5638

4.2883

4.0386

3.8115

3.6046

3.4155

8

7.3255

6.7327

6.4632

6.2098

5.7466

5.3349

4.9676

4.6389

4.3436

4.0776

3.8372

3.6193

9

8.1622

7.4353

7.1078

6.8017

6.2469

5.7590

5.3282

4.9464

4.6065

4.3030

4.0310

3.7863

10

8.9826

8.1109

7.7217

7.3601

6.7101

6.1446

5.6502

5.2161

4.8332

4.4941

4.1925

3.9232

11

9.7868

8.7605

8.3064

7.8869

7.1390

6.4951

5.9377

5.4527

5.0286

4.6560

4.3271

4.0354

12

10.5753

9.3851

8.8633

8.3838

7.5361

6.8137

6.1944

5.6603

5.1971

4.7932

4.4392

4.1274

13

11.3484

9.9856

9.3936

8.8527

7.9038

7.1034

6.4235

5.8424

5.3423

4.9095

4.5327

4.2028

14

12.1062

10.5631

9.8986

9.2950

8.2442

7.3667

6.6282

6.0021

5.4675

5.0081

4.6106

4.2646

15

12.8493

11.1184

10.3797

9.7122

8.5595

7.6061

6.8109

6.1422

5.5755

5.0916

4.6755

4.3152

16

13.5777

11.6523

10.8378

10.1059

8.8514

7.8237

6.9740

6.2651

5.6685

5.1624

4.7296

4.3567

17

14.2919

12.1657

11.2741

10.4773

9.1216

8.0216

7.1196

6.3729

5.7487

5.2223

4.7746

4.3908

18

14.9920

12.6593

11.6896

10.8276

9.3719

8.2014

7.2497

6.4674

5.8178

5.2732

4.8122

4.4187

19

15.6785

13.1339

12.0853

11.1581

9.6036

8.3649

7.3658

6.5504

5.8775

5.3162

4.8435

4.4415

20

16.3514

13.5903

12.4622

11.4699

9.8181

8.5136

7.4694

6.6231

5.9288

5.3527

4.8696

4.4603

Annual rate of return method

The three previous capital budgeting methods were based on cash flows. The uses accrual‐based net income to calculate a project's expected profitability. The annual rate of return is compared to the company's required rate of return. If the annual rate of return is greater than the required rate of return, the project may be accepted. The higher the rate of return, the higher the project would be ranked.

The annual rate of return is a percentage calculated by dividing the expected annual net income by the average investment. Average investment is usually calculated by adding the beginning and ending project book values and dividing by two.

Assume the Cottage Gang has expected annual net income of $5,572 with an investment of $150,000 and a salvage value of $5,000. This proposed project has a 7.2% annual rate of return ($5,572 net income ÷ $77,500 average investment).

The annual rate of return should not be used alone in making capital budgeting decisions, as its results may be misleading. It uses accrual basis of accounting and not actual cash flows or time value of money.


Back to Top
×
A18ACD436D5A3997E3DA2573E3FD792A