Two-Sample z-test for Comparing Two Means
Requirements: Two normally distributed but independent populations, σ is known
Hypothesis test
Formula: 
where  and
and  are the means of the two samples, Δ is the hypothesized difference between the population means (0 if testing for equal means), σ 1 and σ 2 are the standard deviations of the two populations, and n 1and n 2are the sizes of the two samples.
The amount of a certain trace element in blood is known to vary with a standard deviation of 14.1 ppm (parts per million) for male blood donors and 9.5 ppm for female donors. Random samples of 75 male and 50 female donors yield concentration means of 28 and 33 ppm, respectively. What is the likelihood that the population means of concentrations of the element are the same for men and women?
Null hypothesis: H 0: μ 1 = μ 2
or H 0: μ 1 – μ 2= 0
alternative hypothesis: H a : μ 1 ≠ μ 2
or: H a : μ 1 – μ 2≠ 0 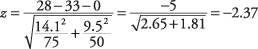
The computed z‐value is negative because the (larger) mean for females was subtracted from the (smaller) mean for males. But because the hypothesized difference between the populations is 0, the order of the samples in this computation is arbitrary—  could just as well have been the female sample mean and
  the male sample mean, in which case z would be 2.37 instead of –2.37. An extreme z‐score in either tail of the distribution (plus or minus) will lead to rejection of the null hypothesis of no difference.
The area of the standard normal curve corresponding to a z‐score of –2.37 is 0.0089. Because this test is two‐tailed, that figure is doubled to yield a probability of 0.0178 that the population means are the same. If the test had been conducted at a pre‐specified significance level of α < 0.05, the null hypothesis of equal means could be rejected. If the specified significance level had been the more conservative (more stringent) α < 0.01, however, the null hypothesis could not be rejected.
In practice, the two‐sample z‐test is not used often, because the two population standard deviations σ 1 and σ 2 are usually unknown. Instead, sample standard deviations and the t‐distribution are used.