Continuing with the earlier example, suppose that ten different samples of 100 people were drawn from the population, instead of just one. You would not expect the income means of these ten samples to be exactly the same, because of sampling variability (the tendency of the same statistic computed from a number of random samples drawn from the same population to differ).
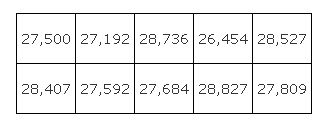
Suppose that the first sample of 100 magazine subscribers was “returned” to the population (made available to be selected again), another sample of 100 subscribers was selected at random, and the mean income of the new sample was computed. If this process were repeated ten times, it might yield the following sample means:
These ten values are part of a sampling distribution. The sampling distribution of a statistic (in this case, of a mean) is the distribution obtained by computing the statistic for all possible samples of a specific size drawn from the same population.
You can estimate the mean of this sampling distribution by summing the ten sample means and dividing by ten, which gives a distribution mean of 27,872.8. Suppose that the mean income of the entire population of subscribers to the magazine is $28,000. (You usually do not know what it is.) You can see in Figure 1 that the first sample mean ($27,500) was not a bad estimate of the population mean and that the mean of the distribution of ten sample means ($27,872) was even better.
Figure 1.Estimation of the population mean becomes progressively more accurate as more samples are taken.
