The interval is (–2.81, 19.81).
You can be 90 percent confident that Brand A cereal has between 2.81 fewer and 19.81 more raisins per box than Brand B. The fact that the interval contains 0 means that if you had performed a test of the hypothesis that the two population means are different (using the same significance level), you would not have been able to reject the null hypothesis of no difference.
If the two population distributions can be assumed to have the same variance—and, therefore, the same standard deviation— s 1and s 2 can be pooled together, each weighted by the number of cases in each sample. Although using pooled variance in a t‐test is generally more likely to yield significant results than using separate variances, it is often hard to know whether the variances of the two populations are equal. For this reason, the pooled variance method should be used with caution. The formula for the pooled estimator of σ 2 is
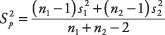
where s 1and s 2are the standard deviations of the two samples and n 1 and n 2are the sizes of the two samples.
The formula for comparing the means of two populations using pooled variance is
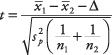
where  and
and  are the means of the two samples, Δ is the hypothesized difference between the population means (0 if testing for equal means), s p 2 is the pooled variance, and n 1and n 2are the sizes of the two samples. The number of degrees of freedom for the problem is
df = n 1+ n 2– 2
Does right‐ or left‐handedness affect how fast people type? Random samples of students from a typing class are given a typing speed test (words per minute), and the results are compared. Significance level for the test: 0.10. Because you are looking for a difference between the groups in either direction (right‐handed faster than left, or vice versa), this is a two‐tailed test.
null hypothesis: H 0: μ 1 = μ 2
or: H 0: μ 1 – μ 2 = 0
alternative hypothesis: H a : μ 1 ≠ μ 2
or: H a : μ 1 – μ 2 ≠ 0
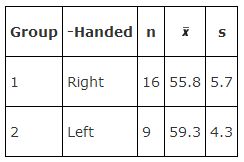
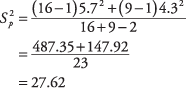
First, calculate the pooled variance:
Next, calculate the t‐value:
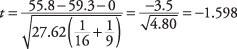
The degrees‐of ‐freedom parameter is 16 + 9 – 2, or 23. This test is a two‐tailed one, so you divide the alpha level (0.10) by two. Next, you look up t .05,23in the t‐table (Table 3 in "Statistics Tables"), which gives a critical value
of 1.714. This value is larger than the absolute value of the computed t of –1.598, so the null hypothesis of equal population means cannot be rejected. There is no evidence that right‐ or left ‐handedness has any effect on typing speed.
|