Requirements: A set of paired observations from a normal population
This t‐test compares one set of measurements with a second set from the same sample. It is often used to compare “before” and “after” scores in experiments to determine whether significant change has occurred.
Hypothesis test
Formula: 
where  is the mean of the change scores, Δ is the hypothesized difference (0 if testing for equal means), s is the sample standard deviation of the differences, and n is the sample size. The number of degrees of freedom for the problem is n – 1.
A farmer decides to try out a new fertilizer on a test plot containing 10 stalks of corn. Before applying the fertilizer, he measures the height of each stalk. Two weeks later, he measures the stalks again, being careful to match each stalk's new height to its previous one. The stalks would have grown an average of 6 inches during that time even without the fertilizer. Did the fertilizer help? Use a significance level of 0.05.
null hypothesis: H 0: μ = 6
alternative hypothesis: H a : μ > 6
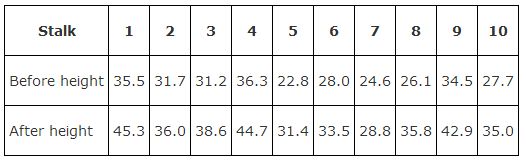
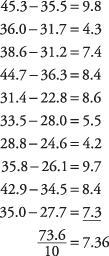
Subtract each stalk's “before” height from its “after” height to get the change score for each stalk; then compute the mean and standard deviation of the change scores and insert these into the formula.
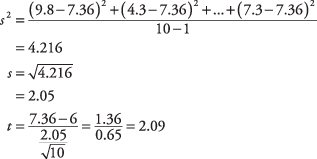
The problem has n – 1, or 10 – 1 = 9 degrees of freedom. The test is one‐tailed because you are asking only whether the fertilizer increases growth, not reduces it. The critical value from the t‐table for t .05,9 is 1.833.
Because the computed t‐value of 2.098 is larger than 1.833, the null hypothesis can be rejected. The test has provided evidence that the fertilizer caused the corn to grow more than if it had not been fertilized. The amount of actual increase was not large (1.36 inches over normal growth), but it was statistically significant.
|