Requirements: Normally distributed population, σ known
Test for population mean
Hypothesis test
Formula: 
where  is the sample mean, Δ is a specified value to be tested, σ is the population standard deviation, and n is the size of the sample. Look up the significance level of the z‐value in the standard normal table (Table
in Appendix
B).
is the sample mean, Δ is a specified value to be tested, σ is the population standard deviation, and n is the size of the sample. Look up the significance level of the z‐value in the standard normal table (Table
in Appendix
B).
A herd of 1,500 steer was fed a special high‐protein grain for a month. A random sample of 29 were weighed and had gained an average of 6.7 pounds. If the standard deviation of weight gain for the entire herd is 7.1, test the hypothesis that the average weight gain per steer for the month was more than 5 pounds.
null hypothesis: H 0: μ = 5
alternative hypothesis: H a: μ > 5
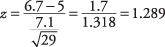
Tabled value for z ≤ 1.28 is 0.8997
1 – 0.8997 = 0.1003
So, the conditional probability that a sample from the herd gains at least 6.7 pounds per steer is p = 0.1003. Should the null hypothesis of a weight gain of less than 5 pounds for the population be rejected? That depends on how conservative you want to be. If you had decided beforehand on a significance level of p < 0.05, the null hypothesis could not be rejected.
In national use, a vocabulary test is known to have a mean score of 68 and a standard deviation of 13. A class of 19 students takes the test and has a mean score of 65.
Is the class typical of others who have taken the test? Assume a significance level of p < 0.05.
There are two possible ways that the class may differ from the population. Its scores may be lower than, or higher than, the population of all students taking the test; therefore, this problem requires a two‐tailed test. First, state the null and alternative hypotheses:
null hypothesis: H 0: μ = 68
alternative hypothesis: H a : μ ≠ 68
Because you have specified a significance level, you can look up the critical z‐value in Table
of Appendix
B before computing the statistic. This is a two‐tailed test; so the 0.05 must be split such that 0.025 is in the upper tail and another 0.025 in the lower. The z‐value that corresponds to –0.025 is –1.96, which is the lower critical z‐value. The upper value corresponds to 1 – 0.025, or 0.975, which gives a z‐value of 1.96. The null hypothesis of no difference will be rejected if the computed z statistic falls outside the range of –1.96 to 1.96.
Next, compute the z statistic: 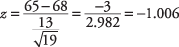
Because –1.006 is between –1.96 and 1.96, the null hypothesis of population mean is 68 and cannot be rejected. That is, there is not evidence that this class can be considered different from others who have taken the test.
Formula: 
where a and b are the limits of the confidence interval,  is the sample mean,
  is the upper (or positive) z‐value from the standard normal table corresponding to half of the desired alpha level (because all confidence intervals are two‐tailed), σ is the population standard deviation, and n is the size of the sample.
A sample of 12 machine pins has a mean diameter of 1.15 inches, and the population standard deviation is known to be 0.04. What is a 99 percent confidence interval of diameter width for the population?
First, determine the z‐value. A 99 percent confidence level is equivalent to p < 0.01. Half of 0.01 is 0.005. The z‐value corresponding to an area of 0.005 is 2.58. The interval may now be calculated: 
The interval is (1.12, 1.18).
We have 99 percent confidence that the population mean of pin diameters lies between 1.12 and 1.18 inches. Note that this is not the same as saying that 99 percent of the machine pins have diameters between 1.12 and 1.18 inches, which would be an incorrect conclusion from this test.
Because surveys cost money to administer, researchers often want to calculate how many subjects will be needed to determine a population mean using a fixed confidence interval and significance level. The formula is 
where n is the number of subjects needed,  is the critical z‐value corresponding to the desired significance level, σ is the population standard deviation, and w is the desired confidence interval width.
How many subjects will be needed to find the average age of students at Fisher College plus or minus a year, with a 95 percent significance level and a population standard deviation of 3.5?
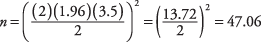
Rounding up, a sample of 48 students would be sufficient to determine students' mean age plus or minus one year. Note that the confidence interval width is always double the “plus or minus” figure.