Test for Comparing Two Proportions
Requirements: Two binomial populations, n π 0≥ 5 and n (1 – π 0) ≥ 5 (for each sample), where π 0 is the hypothesized proportion of successes in the population.
Difference test
Hypothesis test
Formula: 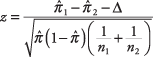
where 
and where  and
and  are the sample proportions, Δ is their hypothesized difference (0 if testing for equal proportions), n 1and n 2are the sample sizes, and x 1and x 2are the number of “successes” in each sample. As in the test for a single proportion, the z distribution is used to test the hypothesis.
A swimming school wants to determine whether a recently hired instructor is working out. Sixteen out of 25 of Instructor A's students passed the lifeguard certification test on the first try. In comparison, 57 out of 72 of more experienced Instructor B's students passed the test on the first try. Is Instructor A's success rate worse than Instructor B's? Use α = 0.10.
null hypothesis: H 0: π 1 = π 2
alternative hypothesis: H a : π 1 < π 2
First, you need to compute the values for some of the terms in the formula.
The sample proportion  is
is  . The sample proportion
  is
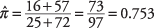
is  . Next, compute
  :
: 
Finally, the main formula:
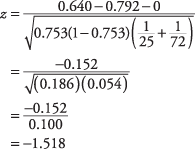
The standard normal ( z) table shows that the lower critical z‐value for α = 0.10 is approximately –1.28. The computed z must be lower than –1.28 in order to reject the null hypothesis of equal proportions. Because the computed z is –1.518, the null hypothesis can be rejected. It can be concluded (at this level of significance) that Instructor A's success rate is worse than Instructor B's.
Formula: 
where 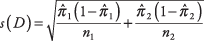
and where a and b are the limits of the confidence interval of π 1 – π 2,  and
and  are the sample proportions,
  is the upper z‐value corresponding to half of the desired alpha level, and n 1 and n 2 are the sizes of the two samples.
A public health researcher wants to know how two high schools—one in the inner city and one in the suburbs—differ in the percentage of students who smoke. A random survey of students gives the following results:
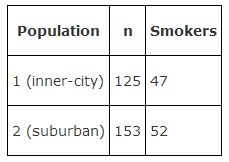
What is a 90 percent confidence interval for the difference between the smoking rates in the two schools?
The proportion of smokers in the inner‐city school is 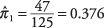 .
.
The proportion of smokers in the suburban school is 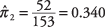 .v Next solve for s( D):
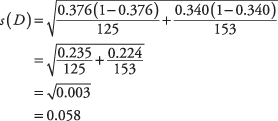
A 90 percent confidence interval is equivalent to α = 0.10, which is halved to give 0.05. The upper tabled value for z .05is 1.65. The interval may now be computed:
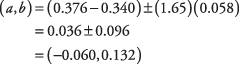
The researcher can be 90 percent confident that the true population proportion of smokers in the inner‐city high school is between 6 percent lower and 13.2 percent higher than the proportion of smokers in the suburban high school. Thus, since the confidence interval contains zero, there is no significant difference between the two types of schools at α = 0.10.
|