Test for a Single Population Proportion
Requirements: Binomial population, sample nπ 0 ≥ 10, and sample n(1 – π 0) ≥ 10, where π 0 is the hypothesized proportion of successes in the population.
Hypothesis test
Formula: 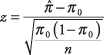
where  is the sample proportion, π 0is the hypothesized proportion, and n is the sample size. Because the distribution of sample proportions is approximately normal for large samples, the z statistic is used. The test is most accurate when π (the population proportion) is close to 0.5 and least accurate when π is close to 0 or 1.
The sponsors of a city marathon have been trying to encourage more women to participate in the event. A sample of 70 runners is taken, of which 32 are women. The sponsors would like to be 90 percent certain that at least 40 percent of the participants are women. Were their recruitment efforts successful?
null hypothesis: H 0: π = 0.4
alternative hypothesis: H 0: π > 0.4
The proportion of women runners in the sample is 32 out of 70, or 45.7 percent. The z‐value may now be calculated: 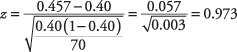
From the z‐table, you find that the probability of a z‐value less than 0.97 is 0.834, so we do not reject the null hypothesis, so it cannot be concluded at that level of significance that the population of runners is at least 40 percent women.
Formula: 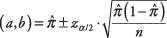
where  is the sample proportion,
  is the upper z‐value corresponding to half of the desired alpha level, and n is the sample size.
A sample of 100 voters selected at random in a congressional district prefer Candidate Smith to Candidate Jones by a ratio of 3 to 2. What is a 95 percent confidence interval of the percentage of voters in the district who prefer Smith?
A ratio of 3 to 2 is equivalent to a proportion of  . A 95 percent confidence interval is equivalent to an alpha level of 0.05, half of which is 0.025. The critical z‐value corresponding to an upper probability of 1 – 0.025 is 1.96. The interval may now be computed:
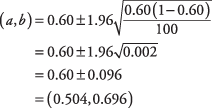
We have 95 percent confidence that between 50.4 percent and 69.6 percent of the voters in the district prefer Candidate Smith. Note that the problem could have been figured for Candidate Jones by substituting the proportion 0.40 for Smith's proportion of 0.60.
In the previous problem, you estimated that the percentage of voters in the district who prefer Candidate Smith is 60 percent plus or minus about 10 percent. Another way to say this is that the estimate has a “margin of error” of ± 10 percent, or a confidence interval width of 20 percent. That is a pretty wide range. You may wish to make the margin smaller.
Because the width of the confidence interval decreases at a known rate as the sample size increases, it is possible to determine the sample size needed to estimate a proportion with a fixed confidence interval. The formula is 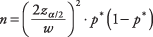
where n is the number of subjects needed,  is the z‐value corresponding to half of the desired significance level, w is the desired confidence interval width, and p* is an estimate of the true population proportion. A p* of 0.50 will result in a higher n than any other proportion estimate but is often used when the true proportion is not known.
How large a sample is needed to estimate the preference of district voters for Candidate Smith with a margin of error of ± 4 percent, at a 95 percent significance level?
You will conservatively estimate the (unknown) true population proportion of preference for Smith at 0.50. If it is really larger (or smaller) than that, you will overestimate the size of the sample needed, but p* = 0.50 is playing it safe.

A sample of about 601 voters would be needed to estimate the percentage of voters in the district who prefer Smith and to be 95 percent certain that the estimate is within ± 4 percent of the true population percentage.