Relative Frequency Histogram
A relative frequency histogram uses the same information as a frequency histogram but compares each class interval to the total number of items. For example, the first interval ($1 to $5) contains 8 out of the total of 32 items, so the relative frequency of the first class interval is  (see Table 1).
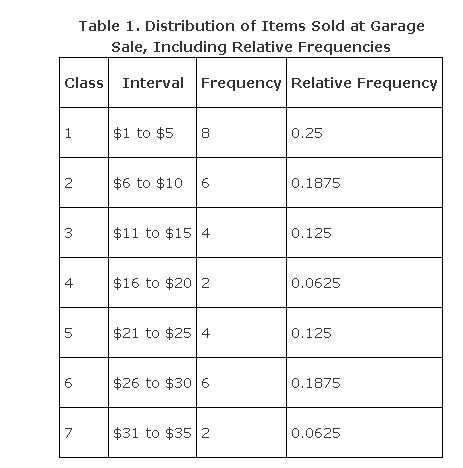
The only difference between a frequency histogram and a relative frequency histogram is that the vertical axis uses relative or proportional frequency instead of simple frequency (see Figure 1).
Figure1 .Relative frequency histogram of items sold at a garage sale.

|
|
|
|
|
|