Graphs of Linear Inequalities
A linear inequality is a sentence in one of the following forms:
-
Ax + By < C
-
Ax + By > C
-
Ax + By ≤ C
-
Ax + By ≥ C
To graph such sentences
-
Graph the linear equation Ax + By = C. This line becomes a boundary line for the graph. If the original inequality is < or >, the boundary line is drawn as a dashed line, since the points on the line do not make the original sentence true. If the original inequality is ≤ or ≥, the boundary line is drawn as a solid line, since the points on the line will make the original inequality true.
-
Select a point not on the boundary line and substitute its x and y values into the original inequality.
-
Shade the appropriate area. If the resulting sentence is true, then shade the region where that test point is located, indicating that all the points on that side of the boundary line will make the original sentence true. If the resulting sentence is false, then shade the region on the side of the boundary line opposite that where the test point is located.
Example 1
Graph 3 x + 4 y < 12.
First, draw the graph of 3 x + 4 y = 12. If you use the x‐intercept and y‐intercept method, you get x‐intercept (4,0) and y‐intercept (0,3). If you use the slope‐intercept method, the equation, when written in slope‐intercept ( y = mx + b) form, becomes 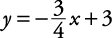
Because the original inequality is <, the boundary line will be a dashed line. Look at Figure 1.
Now select a point not on the boundary, say (0,0). Substitute this into the original inequality: 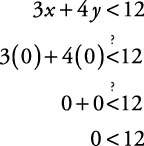
This is a true statement. This means that the “(0,0) side” of the boundary line is the desired region to be shaded. Now, shade that region as shown in Figure 2.
Figure 1. The boundary is dashed.

Figure 2. The shading is below the line.

Example 2
Graph y ≥ 2 x + 3.
First, graph y = 2 x + 3 (see Figure 3).
Notice that the boundary is a solid line, because the original inequality is ≥. Now, select a point not on the boundary, say (2,1), and substitute its x and y values into y ≥ 2 x + 3.

This is not a true statement. Because this replacement does not make the original sentence true, shade the region on the opposite side of the boundary line (see Figure 4).
Figure 3. This boundary is solid.

Figure 4. Shading shows greater than or equal to.

Example 3
Graph x < 2.
The graph of x = 2 is a vertical line whose points all have the x‐coordinate of 2 (see Figure 5).
Select a point not on the boundary, say (0,0). Substitute the x value into x < 2.

This is a true statement. Therefore, shade in the “(0,0) side” of the boundary line (see Figure 6).
Figure 5. Dashed graph of x = 2.

Figure 6. x less than 2 is shaded.
