Systems of Equations Solved Graphically
Graphs can be used to solve systems of equations. This method, however, usually allows only approximate solutions, whereas the algebraic method arrives at exact solutions.
Example 1
Solve the following system of equations graphically.
-
(1)
x 2 + 2 y 2 = 10
-
(2)
3 x 2 – y 2 = 9
Equation (1) is the equation of an ellipse. Convert the equation into standard form.
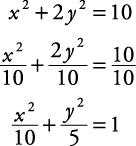
The major intercepts are at  and
and  , and the minor intercepts are at
  and
and  .
.
Equation (2) is the equation of a hyperbola. Convert the equation into standard form.
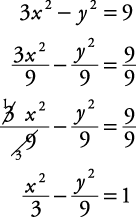
The transverse axis is horizontal, and the vertices are at  and
and  , as shown in Figure 1.
The approximate answers are 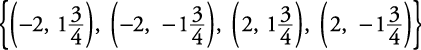
The exact answers are 
Refer to Example
for the algebraic approach to this problem; it gives the exact answers.
Figure 1. Approximate solutions to hyperbola and ellipse.

Example 2
Solve the following system of equations graphically.
-
(1)
x 2 + y 2 = 100
-
(2)
x – y = 2
Equation (1) is the equation of a circle centered at (0, 0) with a radius of 10. Equation (2) is the equation of a line. The solutions are
{(–6, –8), (8, 6)}
The graph is shown in Figure 2.
Refer to Example
for the algebraic approach to this problem.
Figure 2. Circle with intersecting line.
