Solving Quadratic Inequalities
To solve a quadratic inequality, follow these steps:
-
Solve the inequality as though it were an equation.
The real solutions to the equation become boundary points for the solution to the inequality.
-
Make the boundary points solid circles if the original inequality includes equality; otherwise, make the boundary points open circles.
-
Select points from each of the regions created by the boundary points. Replace these “test points” in the original inequality.
-
If a test point satisfies the original inequality, then the region that contains that test point is part of the solution.
-
Represent the solution in graphic form and in solution set form.
Example 1
Solve ( x – 3)( x + 2) > 0.
Solve ( x – 3)( x + 2) = 0. By the zero product property, 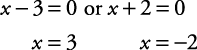
Make the boundary points. Here, the boundary points are open circles because the original inequality does not include equality (see Figure 1).
Select points from the different regions created (see Figure 2).

See whether the test points satisfy the original inequality.
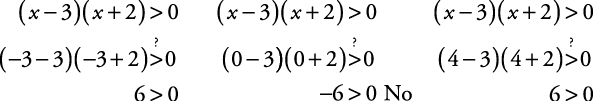
Since x = –3 satisfies the original inequality, the region x < –2 is part of the solution. Since x = 0 does not satisfy the original inequality, the region –2 < x < 3 is not part of the solution. Since x = 4 satisfies the original inequality, the region x > 3 is part of the solution.
Represent the solution in graphic form and in solution set form. The graphic form is shown in Figure 3.
The solution set form is { x| x < –2 or x > 3}.
Figure 1. Boundary points.

Figure 2. Three regions are created.
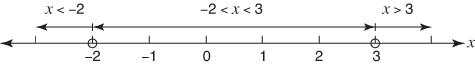
Figure 3. Solution to Example

Example 2
Solve 9 x 2 – 2 ≤ –3 x.

By factoring, 
Mark the boundary points using solid circles, as shown in Figure 4, since the original inequality includes equality.
Select points from the regions created (see Figure 5).

See whether the test points satisfy the original inequality.

Since x = –1 does not satisfy the original inequality, the region  is not part of the solution. Since x = 0 does satisfy the original inequality, the region
  is part of the solution. Since x = 1 does not satisfy the original inequality, the region
  is not part of the solution.
Represent the solution in graphic form and in solution set form. The graphic form is shown in Figure 6.
The set form is 
Figure 4. Solid dots mean inclusion.

Figure 5. Regions to test for Example
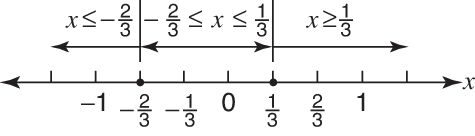
Figure 6. Solution to Example.

Example 3
Solve 4 t 2 – 9 < –4 t.

Since this quadratic is not easily factorable, the quadratic formula is used to solve it.

Reduce by dividing out the common factor of 4.

Since  is approximately 3.2,
Mark the boundary points using open circles, as shown in Figure 7, since the original inequality does not include equality.
Select points from the different regions created (see Figure 8).

See whether the test points satisfy the original inequality.


Since t = 3 does not satisfy the original inequality, the region  is not part of the solution. Since t = 0 does satisfy the original inequality, the region
  is part of the solution. Since t = 2 does not satisfy the original inequality, the region
  is not part of the solution.
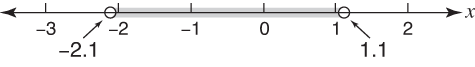
Represent the solution in graphic form and in solution set form. The graphic form is shown in Figure 9.
The solution set form is 
Figure 7. Open dots mean exclusion.

Figure 8. Regions to test for Example.
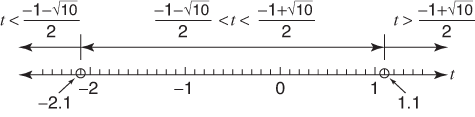
Figure 9. Solution to Example.
Example 4
Solve 
Since this quadratic is not factorable using rational numbers, the quadratic formula will be used to solve it.

These are imaginary answers and cannot be graphed on a real number line. Therefore, the inequality x 2 + 2 x + 5 < 0 has no real solutions.