Graphing Polynomial Functions
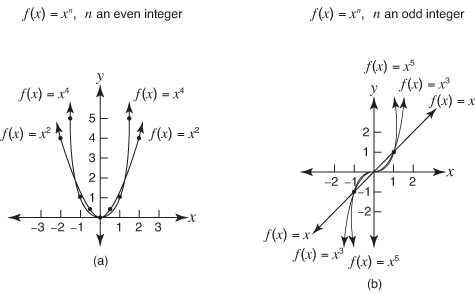
Polynomial functions of the form f ( x) = x n (where n is a positive integer) form one of two basic graphs, shown in Figure 1.
Figure 1. Graphs of polynomials
 Graphs of polynomials.
Each graph has the origin as its only x‐intercept and y‐intercept. Each graph contains the ordered pair (1,1). If a polynomial function can be factored, its x‐intercepts can be immediately found. Then a study is made as to what happens between these intercepts, to the left of the far left intercept and to the right of the far right intercept.
Example 1
Graph f ( x) = x 4 – 10 x 2 + 9.
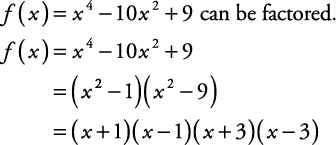
The zeros of this function are –1, 1, –3, and 3. That is, –1, 1, –3, and 3 are the x‐intercepts of this function.
When x < –3, say, x = –4, then 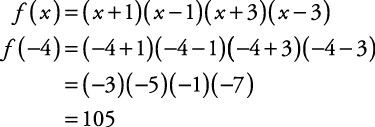
So for x < –3, f ( x) > 0.
When –1 < x < 1, say, x = 0, then 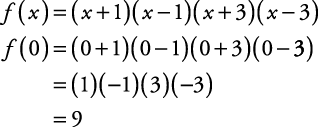
So for –1 < x < 1, f ( x) > 0.
In a similar way, it can be seen that
-
when x > 3, f ( x) > 0
-
when –3 < x < –1, f ( x) < 0
-
when 1 < x < 3, f ( x) < 0
The graph then has points in the shaded regions as shown in Figure 2.
The y‐intercept of this function is found by finding f (0).
f (0) = 9
so (0, 9) is a point on the graph. To complete the graph, find and plot several points. Evaluate f ( x) for several integer replacements; then connect these points to form a smooth curve (see Figure 3).
Notice that f ( x) = x 4 – 10 x 2 + 9 has a leading term with an even exponent. The far right and far left sides of the graph will go in the same direction. Because the leading coefficient is positive, the two sides will go up. If the leading coefficient were negative, the two sides would go down.
Figure 2. Graph of f(x).

Figure 3. Zeros of a function.

Example 2
Graph f ( x) = x 3 – 19 x + 30.
f ( x) = x 3 – 19 x + 30 can be factored using the rational zero theorem:
|
p/q
|
1
|
0
|
–19
|
30
|
|---|
|
1
|
1
|
1
|
–18
|
12
|
|
–1
|
1
|
–1
|
–18
|
48
|
|
2
|
1
|
2
|
–15
|
0
|
f ( x) can now be written in factored form and further factored.
= ( x – 2)( x – 3)( x + 5)
The zeros of this function are 2, 3, and –5 (see Figure 4).
Notice that f ( x) = x 3 – 19 x + 30 has a leading term that has a positive coefficient and an odd exponent. This function will always go up toward the far right and down toward the far left. If the leading coefficient were negative with an odd exponent, the graph would go up toward the far left and down toward the far right.
Figure 4. A cubic equation.
