Linear Inequalities: Solutions Using Graphing with Two Variables
Example 1
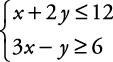
Graph the solution to this system of inequalities.
To graph the solution to a system of inequalities, follow this procedure:
-
Graph each sentence on the same set of axes.
-
See where the shading of the sentences overlaps.
The overlapping region is the solution to the system of inequalities. The solution to the system is the region with both shadings (see Figure 1).
The solution to the following is, therefore, as shown in Figure 2.
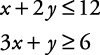
Figure 1. A system of inequalities.

Figure 2. The solution to the system in Example

.
Example 2
Graph the solution to this system of inequalities.

Because no overlapping regions exist, this system has no solutions (see Figure 3).
Figure 3. A system involving parallel lines may lack a solution.

Example 3
Solve this system by graphing.

The graphs are shown in Figure 4.
The resulting solution is shown in Figure 5.
Figure 4. Three linear inequalities.

Figure 5. The solution triangle.
