Systems of Inequalities Solved Graphically
To graph the solutions of a system of inequalities, graph each inequality and find the intersections of the two graphs.
Example 1
Graph the solutions for the following system.
-
(1)
x 2 + y 2 ≤ 16
-
(2)
y ≤ x 2 + 2
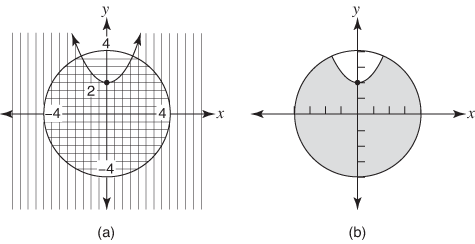
Equation (1) is the equation of a circle centered at (0, 0) with a radius of 4. Graph the circle; then select a test point not on the circle and place it into the original inequality. If that result is true, then shade the region where the test point is located. Otherwise, shade the other region. Use (0, 0) as a test point.
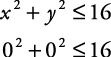
This is a true statement. Therefore, the interior of the circle is shaded. In Figure 1(a), this shading is done with horizontal lines.
Equation (2) is the equation of a parabola opening upward with its vertex at (0, 2). Use (0, 0) as a test point.

This is a true statement. Therefore, shade the exterior of the parabola. In Figure 1(a), this shading is done with vertical lines. The region with both shadings represents the solutions of the systems of inequalities. That solution is shown by the shading on the right side of Figure 1(b).
Figure 1. Shading shows solutions.
Example 2
Solve the following system of inequalities graphically.
-
(1)

-
(2)

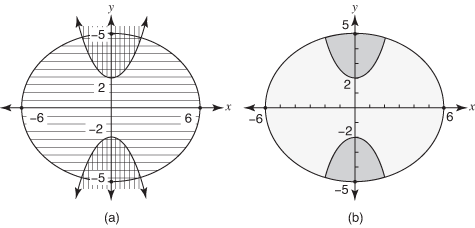
Equation (1) is the equation of an ellipse centered at (0, 0) with major intercepts at (6, 0) and (–6, 0) and minor intercepts at (0, 5) and (0, –5). Use (0, 0) as a test point.

This is a true statement. Therefore, shade the interior of the ellipse. In Figure 2(a), this shading is done horizontally.
Equation (2) is the equation of a hyperbola centered at (0, 0) opening vertically with vertices at (0, 2) and (0, –2). Use (0, 0) as a test point.

This is not a true statement. Therefore, shade the area inside the curves of the hyperbola. In Figure 2(a), this shading is done vertically. The region with both shadings represents the solution to the system of inequalities. That solution is shown by the shading in Figure 2(b).
Figure 2. Solution to Example.