A hyperbola is the set of all points in a plane such that the absolute value of the difference of the distances between two fixed points stays constant. The two given points are the foci of the hyperbola, and the midpoint of the segment joining the foci is the center of the hyperbola. The hyperbola looks like two opposing “U‐shaped” curves, as shown in Figure 1.
Figure 1. Properties of hyperbolas.
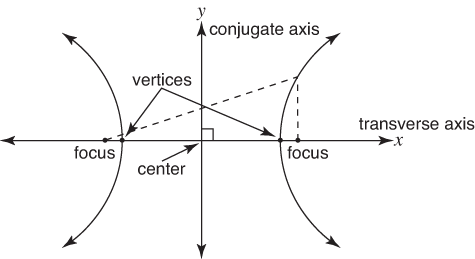
A hyperbola has two axes of symmetry (refer to Figure 1). The axis along the direction the hyperbola opens is called the transverse axis. The conjugate axis passes through the center of the hyperbola and is perpendicular to the transverse axis. The points of intersection of the hyperbola and the transverse axis are called the vertices (singular, vertex) of the hyperbola.
A hyperbola centered at (0, 0) whose transverse axis is along the x‐axis has the following equation as its standard form.
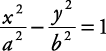
where ( a, 0) and (– a, 0) are the vertices and ( c, 0) and (– c, 0) are its foci.
In the hyperbola, 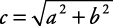 . Don't confuse this with the ellipse formula,
 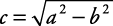 .
.
As points on a hyperbola get farther from its center, they get closer and closer to two lines called asymptote lines. The asymptote lines are used as guidelines in sketching the graph of a hyperbola. To graph the asymptote lines, form a rectangle by using the points (– a, b), (– a, – b), ( a, b), and ( a, – b) and draw its diagonals as extended lines.
For the hyperbola centered at (0, 0) whose transverse axis is along the x‐axis, the equation of the asymptote lines becomes 
Example 1
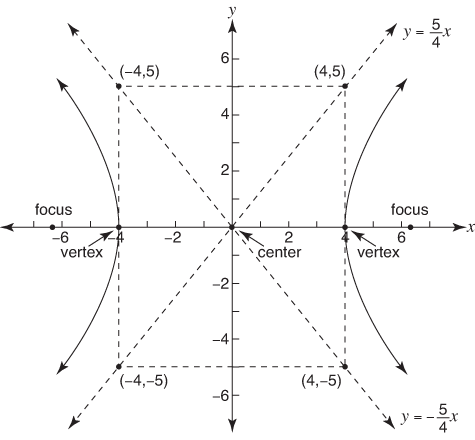
Graph the following hyperbola. Find its center, vertices, foci, and the equations of its asymptote lines.
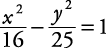
This is a hyperbola with center at (0, 0), and its transverse axis is along the x‐axis.
Vertices: (–4, 0) (4, 0)
Foci: 

Equations of asymptote lines: 
The graph of this hyperbola is shown in Figure 2.
A hyperbola centered at (0, 0) whose transverse axis is along the y‐axis has the following equation as its standard form.
The vertices are now (0, a) and (0, – a). The foci are at (0, c) and (0, – c) with c 2 = a 2 + b 2. The asymptote lines have equations 
In general, when a hyperbola is written in standard form, the transverse axis is along, or parallel to, the axis of the variable that is not being subtracted.
Figure 2. Center, asymptotes, foci, and vertices.
Example 2
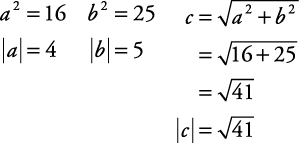
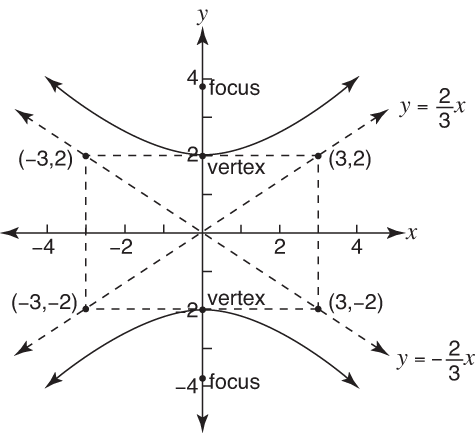
Graph the following hyperbola and find its center, vertices, foci, and equations of the asymptote lines.

This is a hyperbola with its center at (0, 0) and its transverse axis along the y‐axis, since the y variable is not being subtracted.

Vertices: (0, 2), (0, –2)
Foci:  ,
, 
Equations of asymptote lines: 
The graph of this hyperbola is shown in Figure 3.
A hyperbola centered at ( h, k) will have the following standard equations:
-
If the transverse axis is horizontal, then 
In this case, the vertices are at ( h + a, k) and ( h – a, k). The foci are at ( h + c, k) and ( h – c, k) where  .
.
-
If the transverse axis is vertical, 
The vertices are at ( h, k + a) and ( h, k – a), and the foci are at ( h, k + c) and ( h, k – c) where c 2 = a 2 + b 2.
Figure 3. The graph of Example.
Example 3
Graph  .
.
Center: (2, –3)
The transverse axis is horizontal.
Vertices: 
Find the coordinates of the corners of the rectangle to help make the asymptote lines.

The graph of this hyperbola is shown in Figure 4.
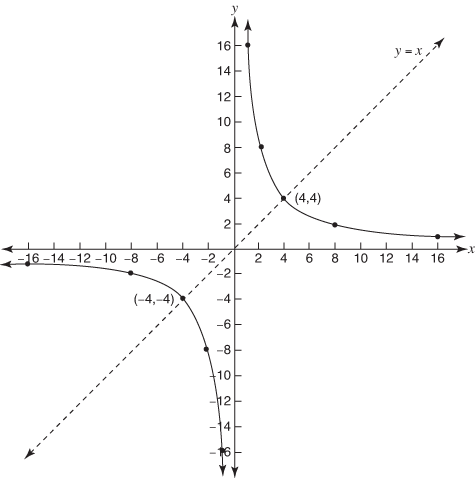
The equation xy = 16 also represents a hyperbola. This hyperbola has its center at (0, 0), and its transverse axis is the line y = x. The asymptotes are the x‐ and y‐axes. Its vertices are at  and
and  . The graph of this hyperbola is shown in Figure 5.
Figure 4. The graph of Example.
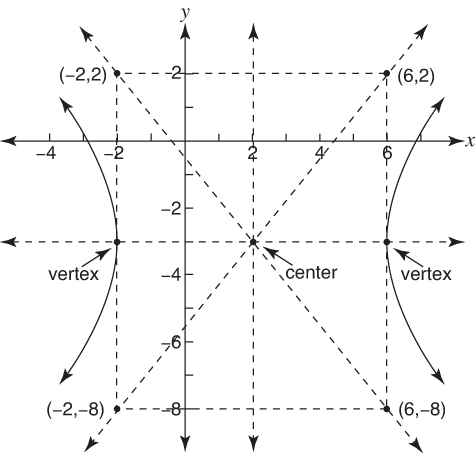
Figure 5. Hyperbola in quadrants I and III.
Example 4
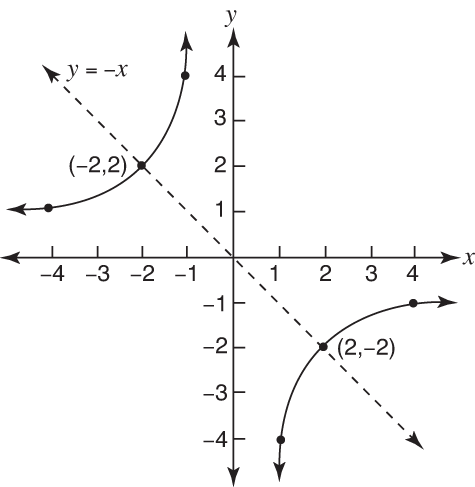
Graph xy = –4.
This hyperbola has its center at (0, 0). The transverse axis is the line y = – x. The asymptotes are the x‐ and y‐axes. The vertices are at  and
and  . The graph of this hyperbola is shown in Figure 6.
Figure 6. Hyperbola in quadrants II and IV.