Equations involving one or two variables can be graphed on any x–y coordinate plane. In general, it is true that
-
if a point lies on the graph of an equation, then its coordinates make the equation a true statement, and
-
if the coordinates of a point make an equation a true statement, then the point lies on the graph of the equation.
The graphs of linear equations are always lines. All linear equations can be written in the form Ax + By = C, where A, B, and C are real numbers and A and B are not both zero. Furthermore, to be in standard form, A has to be a positive number. Following are examples of linear equations and their respective A, B, and C values.
|
x + y = 0
|
3x – 4y = 9
|
x = –6
|
y = 7
|
|---|
|
A = 1
|
A = 3
|
A = 1
|
A = 0
|
|
B = 1
|
B = –4
|
B = 0
|
B = 1
|
|
C = 0
|
C = 9
|
C = –6
|
C = 7
|
Following are terms with which you should be familiar:
-
Standard form. The form Ax + By = C for the equation of a line is known as the standard form for the equation of a line.
-
x‐intercept. The x‐intercept of a graph is the point at which the graph will intersect the x‐axis. It will always have a y‐coordinate of zero. A horizontal line that is not the x‐axis will have no x‐intercept.
-
y‐intercept. The y‐intercept of a graph is the point at which the graph will intersect the y‐axis. It always has an x‐coordinate of zero. A vertical line that is not the y‐axis has no y‐intercept.
One way to graph a linear equation is to find solutions by giving a value to one variable and solving the resulting equation for the other variable. A minimum of two points is necessary to graph a linear equation.
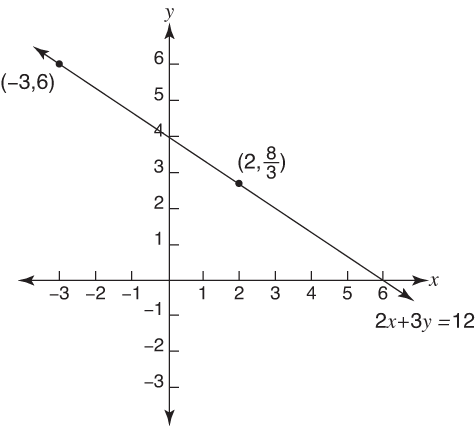
Example 1
Draw the graph of 2 x + 3 y = 12 by finding two random points.
To do this, select a value for one variable; then substitute this into the equation and solve for the other variable. Do this a second time with new values to get a second point.
Let x = 2; then find y.
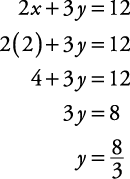
Therefore, the ordered pair  belongs on the graph.
Let y = 6; then find x.
Therefore, the ordered pair (–3,6) belongs on the graph.
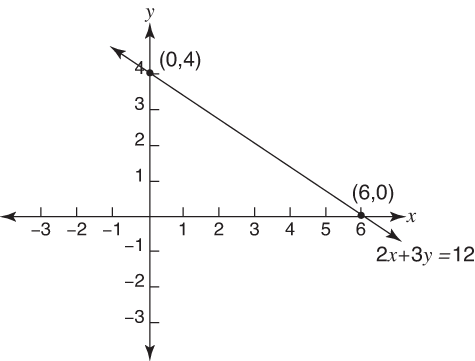
As shown in Figure 1, graph these points and then connect them to make the line that represents the graph of 2 x + 3 y =12.
Figure 1. 2 x +3 y = 12.
Example 2
Draw the graph of 2 x + 3 y = 12 by finding the x‐intercept and the y‐intercept.
The x‐intercept has a y‐coordinate of zero. Substituting zero for y, the resulting equation is
2 x + 3(0) = 12
Now, solving for x, 
The x‐intercept is at (6,0).
The y‐intercept has an x‐coordinate of zero. Substituting zero for x, the resulting equation is
2(0) + 3 y = 12
Now, solving for y, 
The y‐intercept is at (0,4).
The line now can be graphed, as shown in Figure 2, by plotting these two points and drawing the line they determine.
Notice that Figures 1 and 2 are exactly the same. Both are the graph of the line 2 x + 3 y = 12.
Figure 2. x‐ and y‐intercepts.
Example 3
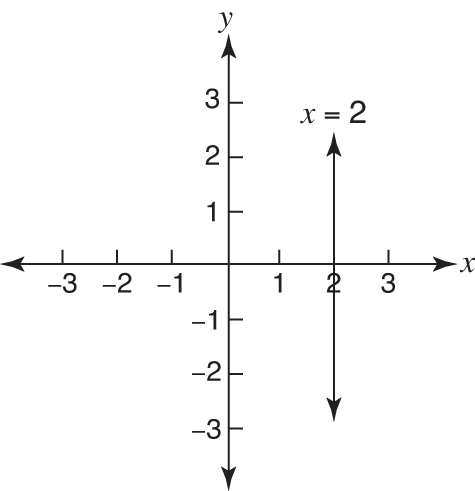
Draw the graph of x = 2.
As shown in Figure 3, x = 2 is a vertical line whose x‐coordinate is always 2.
Figure 3. x = 2 for all y values.
Example 4
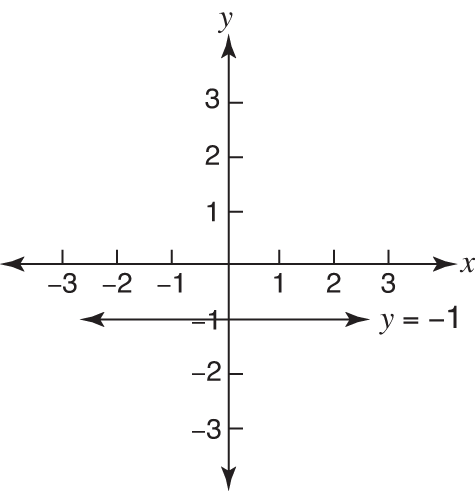
Draw the graph of y = –1.
As shown in Figure 4, y = –1 is a horizontal line whose y‐coordinate is always –1.
Suppose that A is a particular point called ( x 1, y 1) and B is any point called ( x, y). Then the slope of the line through A and B is represented by 
Apply the cross products property, and the equation becomes
y – y 1 = m( x – x 1)
This is the point‐slope form of a nonvertical line.
Figure 4. y = –1 for all x values.
Example 5
Find the equation of the line containing the points (–3,4) and (7,2) and write the equation in both point‐slope form and standard form.
For the point‐slope form, first find the slope, m.

Now, choose either given point, say (–3,4), and substitute the x and y values into the point‐slope form.

For the standard form, begin with the point‐slope form and clear it of fractions by multiplying both sides by the least common denominator.

Multiply both sides by 5.

Get x and y on one side and the constants on the other side by adding x to both sides and adding 20 to both sides. Make sure that A is a positive number.
x + 5 y = 17
A nonvertical line written in standard form is Ax + By = C, with B ≠ 0. Solve this equation for y.

The value  becomes the slope of the line, and
  becomes thev y‐intercept value. If
  is replaced with m and
  is replaced with b, the equation becomes y = mx + b. This is known as the slope‐intercept form of a nonvertical line.
Example 6
Find the slope and y‐intercept value of the line with the equation 3 x – 4 y = 20.
Solve for y.

Therefore, the slope of the line is  , and the y‐intercept value is –5.
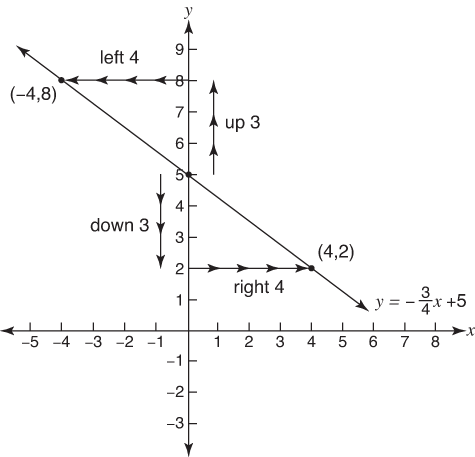
Example 7
Draw the graph of the equation  .
.
The equation is in slope‐intercept form. The slope is  , and the y‐intercept is (0,5). From this, the graph can be quickly drawn. Because the slope is negative, the line is slanting to the upper left/lower right. Begin with the y‐intercept (0,5) and use the slope to find additional points. Either go up 3 and left 4 or go down 3 and right 4. Now, label these points and connect them. Look at Figure 5.
Slope‐intercept form.