Graphing Rational Functions
If f(x) represents a rational expression, then y = f(x) is a rational function. To graph a rational function, first find values for which the function is undefined. A function is undefined for any values that would make any denominator become zero. Dashed lines are drawn on the graph for any values for which the rational function is undefined. These lines are called vertical asymptote lines. The graph of the rational function will get close to these vertical asymptote lines but will never intersect them. Technically speaking, asymptotes show approachable but unattainable points and are not themselves actually parts of the graph of the function. They may be horizontal lines, vertical lines, or slant lines.
Example 1
Graph  .
.
First, the function is undefined when x = –1. So the graph of x = –1 becomes a vertical asymptote.
Second, find whether any horizontal asymptotes exist. To do this, solve the equation for x and see whether any values for y would make the new equation undefined. It may not always be easy to solve a rational function for x. For those cases, other methods are used involving the idea of limits, which is discussed in calculus.

Apply the cross products rule.
This equation is undefined when y = 0. The graph of y = 0 becomes a horizontal asymptote. The graph of x = –1 and y = 0 is shown in Figure 1.
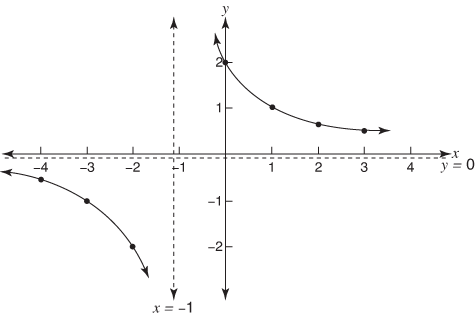
Third, plot the following points on each side of each asymptote line and use them to sketch the graph (see Figure 2).
x |

|
y |
–4 |

|

|
–3 |

|
–1 |
–2 |

|
–2 |
–1 |

|
undefined |
0 |

|
2 |
1 |

|
1 |
2 |

|

|
3 |

|

|
Figure 1. x = –1 and y = 0 are asymptotes.
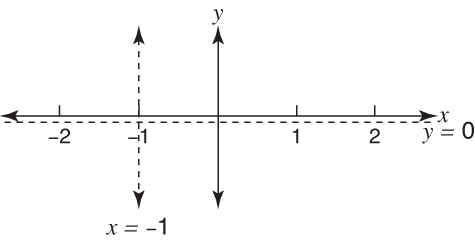
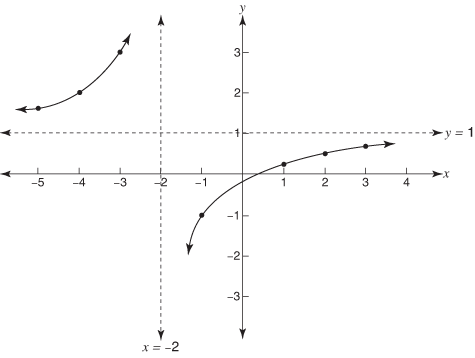
Figure 2. Graphs don't hit asymptotes.
Example 2
Graph  .
.
First, x = –2 is the vertical asymptote.
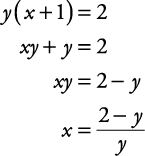
Second, find any horizontal asymptotes that exist by solving the equation for x.

Apply the cross products rule.

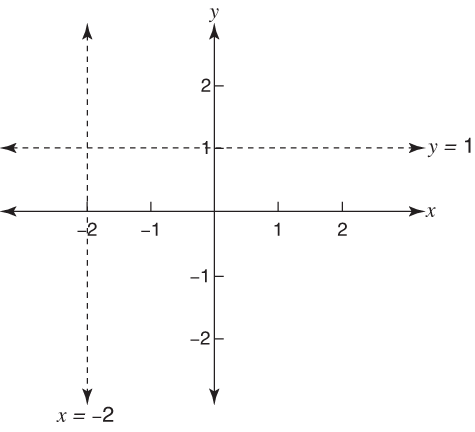
This equation is undefined when y = 1, so y = 1 is a horizontal asymptote, as shown in Figure 3.
Third, plot these points on either side of each asymptote line and sketch the graph as shown in Figure 4.
x |

|
y |
–5 |

|

|
–4 |

|
–2 |
–3 |

|
3 |
–2 |

|
undefined |
–1 |

|
–1 |
0 |

|
0 |
1 |

|

|
2 |

|

|
3 |

|

|
Figure 3. y = 1 is a horizontal asymptote, and x = –2 is a vertical asymptote.
The expression is plotted.