Bar graphs convert the information in a chart into separate bars or columns. Some graphs list numbers along one edge and places, dates, people, or things (individual categories) along another edge. Always try to determine the relationship between the columns in a graph or chart.
Example 1
The bar graph shown in Figure 1 indicates that City W has approximately how many more billboards than does City Y?
Notice that the graph shows the “Number of Billboards in Each City,” with the numbers given along the bottom of the graph in increments of 100. The names are listed along the left side. City W has approximately 500 billboards. The bar graph for City Y stops about halfway between 100 and 200. Now, consider that halfway between 100 and 200 would be 150. So City W (500) has approximately 350 more billboards than does City Y (150).
Figure 1. Horizontal bar graph of billboards in each city.
500 – 150 = 350

Example 2
Based on the bar graph shown in Figure 2.
1. The number of books sold by Mystery Mystery 1990–1992 exceeded the number of those sold by All Sports by approximately how many?
2. From 1991 to 1992, the percent increase in number of books sold for All Sports exceeded the percent increase of Mystery Mystery by approximately how much?
3. What caused the 1992 decline in Reference Unlimited's number of books sold?
The graph in Figure 2 contains multiple bars representing each publisher. Each single bar stands for the number of books sold in a single year. You may be tempted to write out the numbers as you do your arithmetic (3.5 million = 3,500,000). Writing out the numbers is unnecessary, as it often is on graphs that use large numbers. Since all measurements are in millions, adding zeros does not add precision to the numbers.
1. Referring to the Mystery Mystery bars, you can see that the number of books sold per year, in millions, is as follows:
Use a piece of paper as a straightedge to determine this last number. Totaling the number of books sold for all three years gives 8.4 million.
2. Referring to the All Sports bars, you can see that number of books sold per year in millions is as follows:
Once again, use a piece of paper as a straightedge, but don't designate numbers beyond the nearest tenth, since the graph numbers prescribe no greater accuracy than this. Totaling the number of books sold for all three years gives 6.1 million.
So, the number of books sold by Mystery Mystery exceeds the number of books sold by All Sports by 2.3 million.
3. Graph and chart questions may ask you to calculate percent increase or percent decrease. The formula for figuring either of these is the same.

In this case, the percent increase in number of books sold by Mystery Mystery can be calculated first.
- Number of books sold in 1991 (in millions) = 2.5
- Number of books sold in 1992 (in millions) = 3.4
- Change (in millions) = 0.9
The 1991 amount is the “starting point,” so 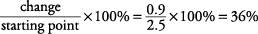
The percent increase in number of books sold by All Sports can be calculated as follows.
- Number of books sold in 1991 (in millions) = 2.1
- Number of books sold in 1992 (in millions) = 3
- Change (in millions) = 0.9
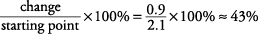
So the percent increase of All Sports exceeds that of Mystery Mystery by 7%:
43% – 36% = 7%
4. This question cannot be answered based on the information in the graph. Never assume information not given. In this case, the multiple factors that could cause a decline in number of books sold are not represented by the graph.
Figure 2. Vertical bar graph showing the number of books sold by three publishers.
