To see how the sine and cosine functions are graphed, use a calculator, a computer, or a set of trigonometry tables to determine the values of the sine and cosine functions for a number of different degree (or radian) measures (see Table 1).
Next, plot these values and obtain the basic graphs of the sine and cosine function (Figure 1 ).
The sine function and the cosine function have periods of 2π; therefore, the patterns illustrated in Figure are repeated to the left and right continuously (Figure 2 ).
Multiple periods of the a) sine function and b) cosine function.
Several additional terms and factors can be added to the sine and cosine functions, which modify their shapes.
The additional term A in the function y = A + sin x allows for a vertical shift in the graph of the sine functions. This also holds for the cosine function (Figure 3 ).
Figure 3
Examples of several vertical shifts of the sine function.
The additional factor B in the function y = B sin x allows for amplitude variation of the sine function. The amplitude, | B |, is the maximum deviation from the x‐axis—that is, one half the difference between the maximum and minimum values of the graph. This also holds for the cosine function (Figure 4 ).

Figure 4
Examples of several amplitudes of the sine function.
Combining these figures yields the functions y = A + B sin x and also y = A + B cos x. These two functions have minimum and maximum values as defined by the following formulas. The maximum value of the function is M = A + |B|. This maximum value occurs whenever sin x = 1 or cos x = 1. The minimum value of the function is m = A ‐ |B|. This minimum occurs whenever sin x = −1 or cos x = −1.
Example 1: Graph the function y = 1 + 2 sin x. What are the maximum and minimum values of the function?
The maximum value is 1 + 2 = 3. The minimum value is 1 −2 = −1 (Figure 5 ).
Figure 5
Drawing for Example 1.
Example 2: Graph the function y = 4 + 3 sin x. What are the maximum and minimum values of the function?
The maximum value is 4 + 3 = 7. The minimum value is 4 − 3 = 1 (Figure 6 ).
Figure 6
Drawing for Example 2.
The additional factor C in the function y = sin Cx allows for period variation (length of cycle) of the sine function. (This also holds for the cosine function.) The period of the function y = sin Cx is 2π/|C|. Thus, the function y = sin 5 x has a period of 2π/5. Figure 7 illustrates additional examples.

Figure 7
Examples of several frequencies of the a) sine function and b) cosine function.
The additional term D in the function y = sin ( x + D) allows for a phase shift (moving the graph to the left or right) in the graph of the sine functions. (This also holds for the cosine function.) The phase shift is | D |. This is a positive number. It does not matter whether the shift is to the left (if D is positive) or to the right (if D is negative). The sine function is odd, and the cosine function is even. The cosine function looks exactly like the sine function, except that it is shifted π/2 units to the left (Figure 8). In other words,
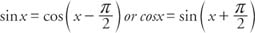
Figure 8
Examples of several phase shifts of the sine function.
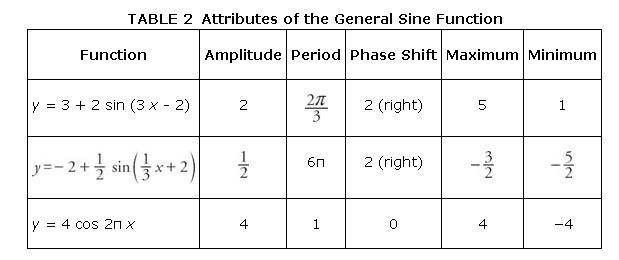
Example 3: What is the amplitude, period, phase shift, maximum, and minimum values of
y = 3+2 sin (3 x‐2)
y = 4 cos2π x
Example 4: Sketch the graph of y = cosπ x.
Because cos x has a period of 2π, cos π x has a period of 2 (Figure 9).

Figure 9
Drawing for Example 4.
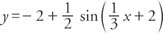
Example 5: Sketch the graph of y = 3 cos (2x + π/2).
Because cos x has a period of 2π, cos 2x has a period of π (Figure 10).
Figure 10
Drawing for Example 5.
The graph of the function y = − f( x) is found by reflecting the graph of the function y = f( x) about the x‐axis. Thus, Figure can also represent the graph of y = −3 sin 2 x. Specifically,
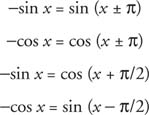
It is important to understand the relationships between the sine and cosine functions and how phase shifts can alter their graphs.
|
|
|
|
|
|
|
|
|
|
|
|
|
|
|
|